

Cassandra Monitoring Tools Comparison 2026
Teams comparing Cassandra monitoring tools are usually choosing between operating models, not just products. One path is the self-managed stack built from JMX Exporter, node_exporter, Prometheus, Grafana, and Loki. Another is to standardize on a managed observability platform such as Datadog, Dynatrace, or Grafana Cloud. Both can work. The real question is how much Cassandra context you get before the monitoring platform becomes another engineering project to own.
AxonOps is included here because it approaches monitoring from the Cassandra side rather than from the generic observability side. That makes it useful in this comparison as a reference point for what deeper Cassandra-specific metrics, operational context, and alerting workflows can look like.
If you want to see that monitoring surface directly, the AxonOps Apache Cassandra monitoring feature page shows how metrics, logs, service checks, and alert routing are presented in the product.
For this article, the self-managed option is treated as one stack because that is how Cassandra teams deploy it in practice. Where a feature is marked as custom, it means the outcome is achievable but not delivered as a documented Cassandra workflow out of the box.
What Cassandra teams need
For Cassandra teams, the basic question is not whether a tool can draw charts. Almost every product in this comparison can do that. The useful questions are whether it understands Cassandra as a database platform, whether it can alert on operational events beyond raw metrics, and whether it lets you route alerts with enough context that the right team can act quickly.
That usually comes down to five areas. First, you need broad metric coverage across Cassandra, the JVM, and the host. Second, you need logs and service checks in the same operational view. Third, you need rules that can cover node failures, saturation, security events, stalled repairs, and failed backups. Fourth, you need alert routing that can follow cluster, datacenter, severity, and domain boundaries. Finally, you need all of this without turning observability itself into a full-time platform project. The comparison below reflects documented, out-of-the-box capabilities as of March 12, 2026.
The Grafana dashboard count and the Datadog and Grafana metric mappings below were rechecked on 15 September 2026. Grafana’s integration documentation lists four dashboards and eight alerts. Its exporter configuration maps table gauges with keyspace and table labels. Datadog’s default mapping includes partition-size gauges and selected read-latency and histogram percentiles for user tables. Check the configuration installed on your nodes because integration releases can change these defaults.
Platform coverage
| Capability | AxonOps | Self-managed stack JMX Exporter + node_exporter + Prometheus + Grafana + Loki |
Datadog | Dynatrace | Grafana Cloud |
|---|---|---|---|---|---|
| Cassandra-native monitoring model | ✓ Full Built around Cassandra clusters, nodes, service checks, repairs, backups, and operational history. |
✗ No Flexible components, but Cassandra context is something you assemble yourself. |
◐ Integration-led Strong integration model, but Cassandra remains one integration among many. |
◐ Extension-led Strong platform-wide correlation, but Cassandra is extension-led rather than domain-led. |
◐ Managed open stack Managed Prometheus, Loki, and Grafana service, but Cassandra still depends on JMX Exporter, Alloy, labels, and dashboards you manage. |
| Cassandra metrics depth | ✓ Full Cassandra, JVM, table, keyspace, coordinator, replica, and infrastructure metrics at 5-second resolution. |
◐ Good Depends on exporter configuration, scrape design, and the dashboards you build. |
◐ Good Datadog's built-in Cassandra Agent check can be pushed beyond the default set, but broader JMX coverage still sits inside Datadog's generic model and can drive up billable custom-metric volume. |
◐ Good Cassandra visibility comes through the extension and broader Dynatrace telemetry. |
◐ Good The Cassandra integration covers cluster, node, and keyspace metrics, but deeper table-level coverage still means extra JMX mapping and more active series. |
| Metrics collection resolution | ✓ 5 seconds High-resolution collection is practical because the collector is designed to stay low profile. |
◐ Configurable Prometheus scrape interval is flexible, but tighter intervals increase Cassandra JVM CPU pressure when JMX Exporter is scraping a large metric surface, and also raise exporter and storage cost. |
◐ Varies by Datadog setup Collection cadence depends on the Datadog configuration, but Datadog bills custom metrics by distinct timeseries rather than submission frequency. |
◐ 1-minute custom metric resolution Dynatrace states that custom metrics ingestion uses a standard 1-minute resolution. |
◐ Configurable A shorter scrape interval sends more data points for each series. Adding metrics or label combinations increases the active-series count. |
| Documented default Cassandra scope | ✓ Deep by default Table metrics, threadpools, consistency-level views, and Cassandra operations are part of the normal product surface. |
◐ Whatever you model Depth depends on exporter rules, scrape design, and the dashboards and alerts you maintain. |
◐ 350 metrics per instance Datadog documents this collection limit for each Cassandra check instance. It is a collection limit rather than the number of Cassandra metric names in the default mapping. |
◐ 28 default custom metrics per process Dynatrace documents 28 default Cassandra JMX metrics per process and a 5,000-metric limit per JMX extension. |
◐ 8 alerts + 4 dashboards Grafana Cloud documents 8 alerts and 4 pre-built dashboards for Cassandra metrics and logs. |
| Primary Cassandra metric collection path | ✓ Bespoke Java collector Bulk Cassandra metric collection bypasses the JMX layer. |
✓ JMX Exporter Cassandra metrics are exposed through JMX and scraped by Prometheus. |
◐ JMX-based Agent check Datadog's built-in Cassandra Agent check uses a JMX collection path, with a separate nodetool check available for extra cluster data. |
◐ OneAgent + Cassandra JMX extension Dynatrace documents Cassandra monitoring through its Cassandra JMX extension. |
◐ Grafana Alloy + JMX Exporter Grafana Cloud documents Cassandra monitoring through JMX Exporter on each node, scraped by Grafana Alloy. |
| Node and infrastructure metrics | ✓ Yes | ✓ Yes | ✓ Yes | ✓ Yes | ✓ Yes |
| Metrics, logs, and Cassandra operational context together | ✓ Full Metrics, logs, service checks, configuration, repairs, backups, and nodetool events in one operational surface. |
◐ Possible Prometheus, Grafana, and Loki can be linked, but you design the labels, dashboards, and drill-downs. |
◐ Metrics + logs Metrics and logs are strong; Cassandra operational workflows still need custom modelling. |
◐ Cross-stack correlation Good cross-stack correlation, but Cassandra-specific operational domains are not first-class. |
◐ Metrics + logs Prometheus metrics and Loki logs can be correlated in one managed stack, though Cassandra operational domains still remain custom work. |
| Configuration visibility | ✓ Full Cassandra, JVM, and OS configuration tracked per node. |
✗ No Needs extra tooling or custom collection. |
✗ Not documented out of the box Datadog's Cassandra Agent check documents JMX metrics and logs, not cassandra.yaml, JVM config, or kernel tuning visibility. |
✗ Not documented out of the box The Apache Cassandra extension documents JMX metrics, logs, and process analysis, not Cassandra yaml, JVM config, or kernel tuning visibility. |
✗ Not documented out of the box Grafana Cloud documents Cassandra metrics and logs through JMX Exporter and Alloy, not Cassandra yaml, JVM configuration, or OS kernel tuning visibility. |
| Service checks for Cassandra availability | ✓ Full Node reachability, CQL, JMX, and flexible custom checks configured server-side with no agent-side changes. |
◐ Custom Achievable, but you need extra jobs and alert logic. |
◐ Host and service checks General service and host checks are available, but not Cassandra-native by default. |
◐ Platform health monitoring Broad health monitoring is strong, though Cassandra service checks are not modeled natively. |
◐ Custom Possible through Prometheus targets, Loki queries, and Grafana Alerting, but not as a Cassandra-native service-check workflow. |
| Repair monitoring | ✓ Yes Real-time progress, full history, and failure alerting. |
✗ Not documented out of the box | ✗ Not documented out of the box | ✗ Not documented out of the box | ✗ Not documented out of the box |
| Backup monitoring | ✓ Yes Execution history, status, duration, and failure alerting. |
✗ Not documented out of the box | ✗ Not documented out of the box | ✗ Not documented out of the box | ✗ Not documented out of the box |
| PromQL-style open query access | ✓ Yes PromQL-compatible API for dashboards and external tooling. |
✓ Yes | ✗ No | ✗ No | ✓ Yes Managed Prometheus and Mimir keep the PromQL query model. |
| Agent overhead | Low Bespoke Java collector designed to stay low profile by bypassing the JMX layer for bulk metric collection. |
Workload-dependent The linked benchmark reports CPU and throughput effects for its tested JMX Exporter configuration. Measure your own metric rules and collection interval under load. |
Not benchmarked here | Not benchmarked here | Workload-dependent Uses JMX Exporter. Test the configured rules and scrape interval on representative clusters before assigning an overhead figure. |
Self-managed stack
The self-managed route still suits teams that already run Prometheus and Grafana well and want full control. The trade-off is that you own JMX Exporter, node_exporter, Loki, Alertmanager, dashboards, retention, and service-check plumbing, and once table count grows the Cassandra JVM can show real CPU spikes during deep JMX scrapes.
For a closer look at that trade-off, see Monitoring Cassandra: The Cost of Collecting Metrics.
Managed observability platforms
Datadog and Dynatrace collect Cassandra metrics through their integrations while Grafana Cloud uses JMX Exporter and Alloy. Compare the default metric mappings with the measurements needed for your workload before deciding what additional configuration is required. Collection methods and billing rules differ between these platforms.
What deeper Cassandra visibility can look like
Cassandra exposes table metrics and coordinator metrics with multiple attributes and percentiles. The number of exported series depends on the version and the attributes and dimensions selected by the collector. Our Datadog Cassandra metric analysis separates the metrics Cassandra exposes from those included in Datadog’s default mapping.
That difference shows up quickly in operations because Cassandra issues are often specific to one consistency path and one part of the latency distribution. Being able to filter coordinator metrics by consistency level and percentile means teams can isolate whether a problem is affecting LOCAL_QUORUM, ONE, or another consistency mode, and whether the issue lives in the tail rather than in the average.
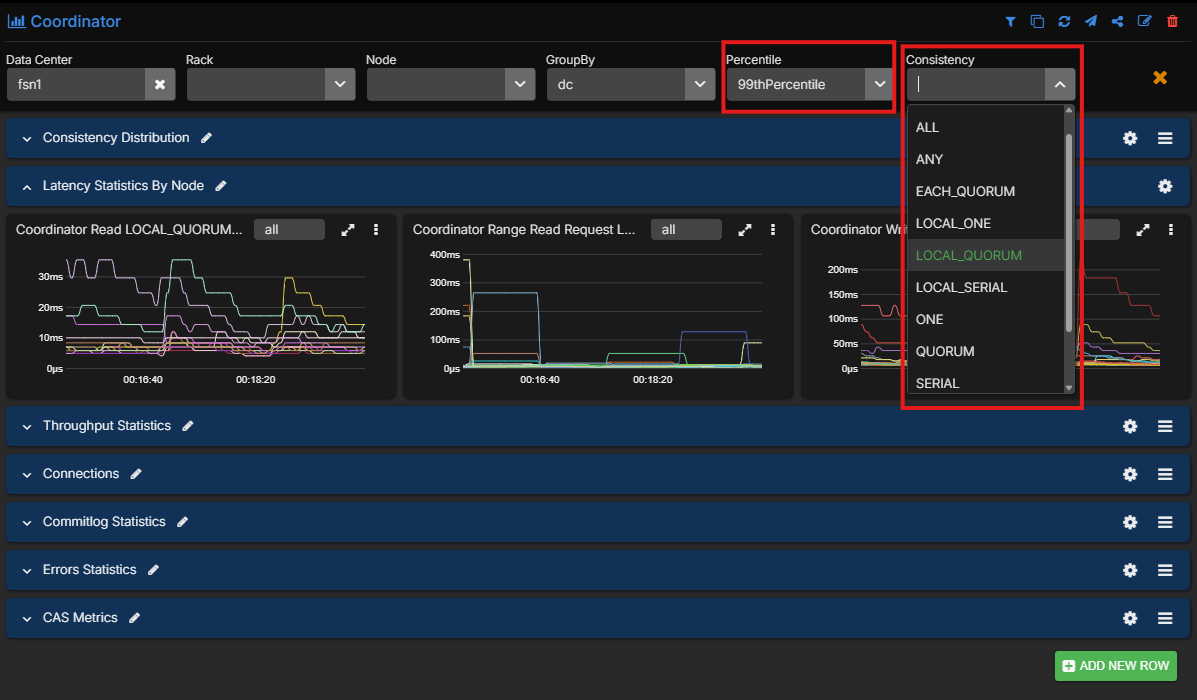
The same applies at table level. Operators can filter down to the exact tables involved instead of staring at keyspace or cluster-wide aggregates and trying to infer where the problem lives.
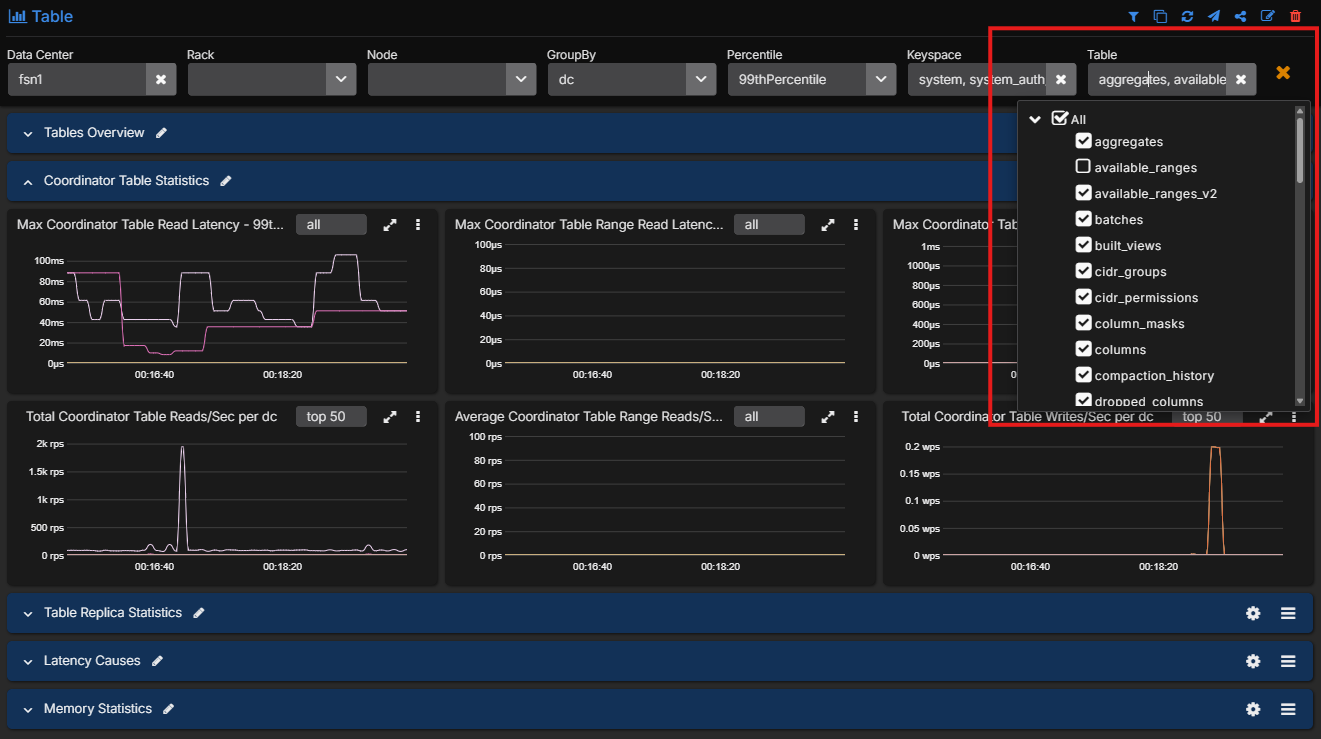
That is also the difference between generic observability and a dedicated Cassandra monitoring workflow. The AxonOps Cassandra monitoring page gives a fuller view of the metrics, logs, service checks, and alerting model behind these screenshots.
Resolution comparison
The charts below show the same short-lived spike rendered at 5-second, 30-second, and 60-second resolutions. This is the practical difference behind the resolution row in the table. At 5 seconds, the spike is obvious. By 30 seconds it is already smoothed. By 60 seconds, short-lived behavior is materially flattened.
Collection interval and metric coverage both affect what you can investigate. A short spike may disappear between samples while a missing table percentile can hide which requests slowed down. Our collector benchmark examines the tested JMX Exporter configuration and other named collectors under load. Those results do not establish the resource usage of collectors that were not included in the test.
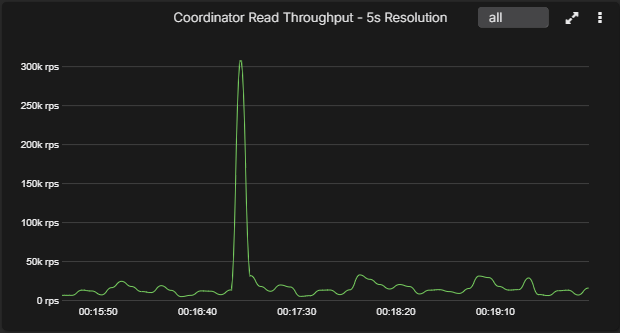
5-second resolution
A short, sharp coordinator throughput spike is preserved with its real peak and duration intact.
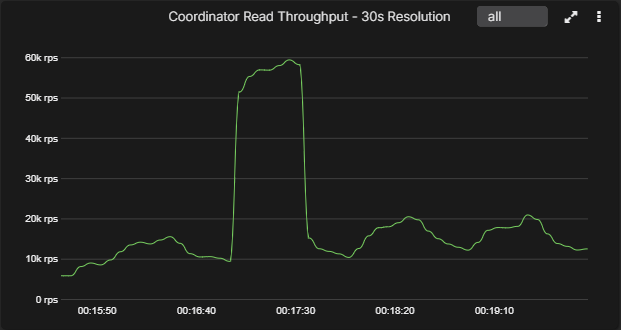
30-second resolution
The same event is already smeared into a much wider plateau, which changes how severe it looks.
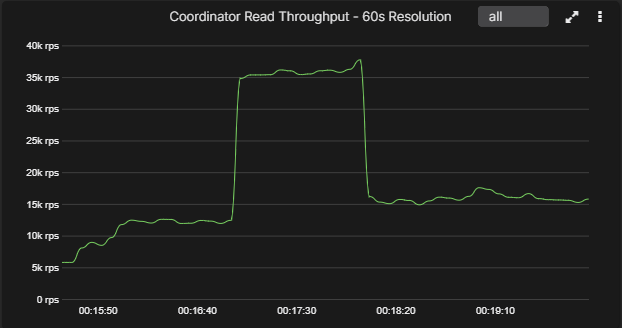
60-second resolution
By 60 seconds, the narrow spike has turned into a broad block and the real peak is largely hidden.
Cassandra metric coverage detail
This is where the difference between a Cassandra-native platform and a generic observability stack becomes concrete. The question is not whether a platform can ingest JMX somewhere. The question is whether the Cassandra metrics you actually care about arrive ready to use, with the right dimensionality and percentile coverage, instead of becoming a custom exporter and dashboard project. For many teams, that is the difference between operating with real instrumentation and operating half-blind.
| Metric or metric family | AxonOps | Self-managed stack | Datadog | Dynatrace | Grafana Cloud |
|---|---|---|---|---|---|
| System / OS | |||||
| OS and node metrics | ✓ Native CPU, memory, disk I/O, filesystem, and network throughput in the same platform. |
✓ Yes | ✓ Yes | ✓ Yes | ✓ Yes |
| JVM internals | ✓ Native Heap, GC, threads, buffers, and JVM process health. |
✓ Yes | ✓ Yes | ✓ Yes | ✓ Yes |
| Coordinator | |||||
| Coordinator throughput per table | ✓ Native | ◐ Possible Requires JMX exporter rules and dashboard work. |
◐ Possible via Datadog Cassandra Agent check | ◐ Possible via Dynatrace Cassandra JMX extension | ◐ Possible with custom JMX Exporter rules |
| Coordinator latency percentiles per table | ✓ Native All percentiles. |
◐ Possible Depends on MBean exposure, mapping, and dashboard design. |
◐ Possible with extra JMX mapping | ◐ Possible with JMX extension customization | ◐ Possible with custom JMX Exporter rules |
| Coordinator metrics by consistency level | ✓ Native All consistency levels and all percentiles. |
◐ Possible Usually custom mapping and dashboarding. |
◐ Not documented out of the box | ◐ Not documented out of the box | ◐ Not documented out of the box |
| Table metrics | |||||
| Replica throughput per table | ✓ Native | ◐ Possible | ◐ Possible via Datadog Cassandra Agent check | ◐ Possible via Dynatrace Cassandra JMX extension | ◐ Possible with custom JMX Exporter rules |
| Replica latency percentiles per table | ✓ Native All percentiles. |
◐ Possible | ◐ Selected defaults p75, p95 and p99 for table read/write latency. |
◐ Possible with JMX extension customization | ◐ Possible with custom JMX Exporter rules |
| Estimated partition count | ✓ Native | ◐ Possible | ◐ Possible via Datadog Cassandra Agent check | ◐ Possible via Dynatrace Cassandra JMX extension | ◐ Possible with custom JMX Exporter rules |
| Max table partition size | ✓ Native | ◐ Possible | ✓ Default mappingMaxPartitionSize for user tables, subject to the check limit. |
◐ Not documented out of the box | ✓ Exporter rulecassandra_table_maxpartitionsize with keyspace and table labels. |
| Mean partition size | ✓ Native | ◐ Possible | ✓ Default mappingMeanPartitionSize for user tables, subject to the check limit. |
◐ Not documented out of the box | ✓ Exporter rulecassandra_table_meanpartitionsize with keyspace and table labels. |
| Tombstones scanned percentiles | ✓ Native All percentiles. |
◐ Possible | ◐ Selected defaults p75 and p95 for user tables. |
◐ Possible with JMX extension customization | ◐ Possible with custom JMX Exporter rules |
| Speculative retries | ✓ Native | ◐ Possible | ◐ Not documented out of the box | ◐ Not documented out of the box | ◐ Not documented out of the box |
| Storage layer | |||||
| Live SSTable count | ✓ Native | ◐ Possible | ◐ Possible via Datadog Cassandra Agent check | ◐ Possible via Dynatrace Cassandra JMX extension | ◐ Possible with custom JMX Exporter rules |
| SSTables read per query percentiles | ✓ Native All percentiles. |
◐ Possible | ◐ Selected defaults p75 and p95 for user tables. |
◐ Possible with JMX extension customization | ◐ Possible with custom JMX Exporter rules |
| Bloom filter disk size | ✓ Native | ◐ Possible | ◐ Possible via Datadog Cassandra Agent check | ◐ Possible via Dynatrace Cassandra JMX extension | ◐ Possible with custom JMX Exporter rules |
| Bloom filter false positive ratio | ✓ Native | ◐ Possible | ✓ Default mappingBloomFilterFalseRatio for user tables. |
◐ Possible with JMX extension customization | ◐ Possible with custom JMX Exporter rules |
| Max table partition size | ✓ Native | ◐ Possible | ✓ Default mappingMaxPartitionSize for user tables, subject to the check limit. |
◐ Not documented out of the box | ✓ Exporter rulecassandra_table_maxpartitionsize with keyspace and table labels. |
| Mean partition size | ✓ Native | ◐ Possible | ✓ Default mappingMeanPartitionSize for user tables, subject to the check limit. |
◐ Not documented out of the box | ✓ Exporter rulecassandra_table_meanpartitionsize with keyspace and table labels. |
| Threadpools | |||||
| Cassandra threadpool health | ✓ Native Active, pending, completed, currently blocked, and all-time blocked metrics across Cassandra threadpools. |
◐ Possible Available through JMX if you model and visualize it yourself. |
◐ Possible via Datadog Cassandra Agent check | ◐ Possible via Dynatrace Cassandra JMX extension | ◐ Possible with custom JMX Exporter rules |
The point of this table is not that the other platforms can never ingest these metrics. Most of them can ingest at least part of the underlying JMX surface. The practical difference is that AxonOps already models these as Cassandra metrics that are usable immediately, including percentile-heavy and consistency-level views. The other options usually require some combination of exporter rules, metric selection, field mapping, dashboard work, and alert engineering before the same data becomes operationally useful.
What this metric depth does to SaaS cost
This is also where the commercial model starts to matter. Generic SaaS observability tools can usually be pushed deeper into Cassandra, but deep per-table telemetry is exactly the point where their default scope stops and billable expansion begins.
For an illustrative sizing calculation, assume a collector exports 67 series per table across 100 tables and five measurements for each of 24 thread pools. These are inputs to the example rather than a count of every metric Cassandra exposes. A second scenario assumes another 24 series for each table and consistency-level combination across eight levels. Whether a collector can provide that breakdown needs separate verification.
- Table-level metrics across 100 tables:
100 × 67 = 6,700metric series per node. - Threadpool metrics:
24 × 5 = 120metric series per node. - Base table-level footprint:
6,700 + 120 = 6,820metric series per node. - If you also break coordinator read, range-read, and write throughput and latency out across
8common consistency levels, add100 × 8 × 24 = 19,200more metric series per node. - Estimated total with consistency-level coverage:
6,820 + 19,200 = 26,020metric series per node.
Datadog is the easiest place to turn that into a public-cost estimate because it publishes both the Cassandra check limit and a public custom-metric price list. The documented 350-metric default for the Cassandra Agent check is not close to this footprint. The 6,820-series base estimate is about 19.5x higher than Datadog’s standard check limit. The 26,020-series estimate with consistency-level coverage is about 74.3x higher.
Datadog’s billing documentation includes 100 indexed custom metrics per host on Pro and pools the allowance across the account. Its published list price is $5 per 100 indexed custom metrics per month. Metrics from accepted integrations are generally outside that custom-metric allowance, so confirm how additional Cassandra measurements will be classified before pricing them.
If all 6,820 series per node in this example were classified as indexed custom metrics throughout the month and the Pro allowance were otherwise unused then the additional charge would be $336 per node per month. The same assumptions applied to 26,020 series give $1,296 per node per month. Across six nodes that would be $2,016 to $7,776 per month before host fees. These are hypothetical custom-metric costs rather than a bill for enabling Datadog’s standard Cassandra integration. They exclude Metrics without Limits ingestion charges and contract-specific terms.
Grafana Cloud publishes a simpler metrics model, but the public Pro pricing baseline assumes 1 data point per minute, which is effectively 60-second resolution. Its Pro plan includes 10k active series at that baseline and then charges $6.50 per 1k series, with a $19 monthly platform fee. On that basis, a six-node Cassandra cluster at the 6,820-series-per-node footprint lands at about 40,920 active series, or roughly $220 per month for metrics. The richer 26,020-series-per-node footprint lands at about 156,120 active series, or roughly $969 per month for metrics.
At a 5-second scrape interval, Grafana Cloud billing moves to 12 DPM, so the six-node cluster totals become much more expensive:
40,920active series across the 6-node cluster: roughly $3,146/month for metrics.156,120active series across the 6-node cluster: roughly $12,131/month for metrics.
That is before logs, users, and any additional Grafana Cloud services.
Validate the billable series and included allowances against your account before using these figures for a budget. Collection limits and pricing are separate from collector performance. The metric-collection benchmark reports resource use for its tested configurations without assigning those measurements to Datadog or Dynatrace.
Alert rule features
| Rule capability | AxonOps | Self-managed stack | Datadog | Dynatrace | Grafana Cloud |
|---|---|---|---|---|---|
| Metric threshold rules | ✓ Yes | ✓ Yes | ✓ Yes | ✓ Yes | ✓ Yes |
| Severity and scope controls | ✓ Native Documented around cluster, datacenter, metric type, and severity. |
◐ Label-driven Powerful, but only if your labels are consistent. |
◐ Tag-driven | ◐ Entity and tag-driven | ◐ Label-driven Powerful once labels and rule groups are modeled well. |
| Log-based alerting | ✓ Yes Cassandra log rules in the same platform as metrics and service checks. |
✓ Yes Loki supports alerting, but it is another component to own. |
✓ Yes | ◐ Log processing path Achievable through log processing and metric events, but not as direct. |
✓ Yes Loki and Grafana Alerting support it, but it still depends on the log labels and queries you maintain. |
| No-data or loss-of-signal detection | ✓ Yes | ✓ Yes | ✓ Yes | ✓ Yes | ✓ Yes |
| Anomaly or baseline-based rules | ◐ Focused on operational thresholds and service checks | ◐ Custom Possible, but usually requires extra recording rules or external logic. |
✓ Yes | ✓ Yes | ◐ Dynamic thresholds Available, but you still define the Cassandra rules and labels yourself. |
| Cassandra operational rules | ✓ Yes Backups, repairs, nodetool tasks, service checks, and security events. |
✗ Not documented out of the box | ✗ Not documented out of the box | ✗ Not documented out of the box | ✗ Not documented out of the box |
| Rule automation | ✓ Yes Terraform can manage AxonOps monitoring and alerting configuration across rules, routes, service checks, and related platform settings. |
✓ Yes Everything is configuration, but you own the full implementation. |
✓ Yes | ✓ Yes | ✓ Yes Terraform provisioning is documented for Grafana rule groups, contact points, and notification policies. |
| Time to first useful Cassandra alert set | Fast | Slow | Medium | Medium | Medium |
This is where the shape of the market becomes clear. Datadog, Dynatrace, and Grafana Cloud all have capable alerting engines. Grafana Cloud is the most open of the three because it stays close to Prometheus and Loki, but it still does not give you Cassandra-native alert coverage for repairs, backups, nodetool workflows, or Cassandra service checks out of the box. The self-managed stack can eventually cover much of this, but only if you are willing to design and maintain the full rule set yourself.
AxonOps wins this section for a different reason. It is opinionated in the right place. Instead of forcing Cassandra teams to translate every operational concept into raw metrics and labels, it already exposes the Cassandra domains that SREs and DBAs actually monitor day to day.
Alert routing features
| Routing capability | AxonOps | Self-managed stack | Datadog | Dynatrace | Grafana Cloud |
|---|---|---|---|---|---|
| Built-in delivery channels | ✓ Broad Slack, Microsoft Teams, ServiceNow, PagerDuty, OpsGenie, SMTP, email, and webhook are documented. |
✓ Broad Alertmanager and Grafana cover the common channels, though across separate components. |
✓ Broad | ✓ Broad | ✓ Broad |
| Routing policy filters | ✓ Yes | ✓ Yes Alertmanager and Grafana are strong here. |
✓ Yes | ✓ Yes | ✓ Yes Notification policies and label matchers are strong here. |
| Routing by Cassandra context | ✓ Native Route by metric domain, cluster, datacenter, node, and severity. |
◐ Custom Possible if labels are carefully designed and kept consistent. |
◐ Tag and team routing Usually tag and team based rather than Cassandra-domain aware. |
◐ Entity and tag routing Entity and tag based rather than Cassandra-domain aware. |
◐ Label and policy routing Possible with notification policies and label matchers, but not Cassandra-domain aware by default. |
| Metrics and logs routed in one model | ✓ Yes | ◐ Shared ownership model Possible, but shared ownership between Prometheus, Alertmanager, Grafana, and Loki matters. |
✓ Yes | ✓ Yes | ✓ Yes |
| Repairs, backups, service checks, and alerts share one routing model | ✓ Yes Repairs, backups, service checks, and security events use the same routing rules as metrics and logs. |
✗ No | ✗ No Custom events can be created, but Cassandra operations are not native objects. |
✗ No | ✗ No |
| On-call handoff quality for Cassandra incidents | High Routing context already matches Cassandra ownership boundaries. |
Variable Depends on how well labels, dashboards, and runbooks were designed. |
Good | Good | Variable Depends on label hygiene, dashboard design, and the runbooks around your Grafana Cloud stack. |
Alert routing is where many Cassandra teams quietly lose time. The issue is not whether a platform can send to Slack or PagerDuty. Most can. The issue is whether the routing model matches how Cassandra ownership works in real environments. If an alert belongs to a specific cluster, datacenter, or operational domain such as repair or backup, the system should already understand that. AxonOps does. The DIY stack can get there with disciplined label design. The general SaaS platforms can usually approximate it with tags and workflows. None of those options is as direct.
What this means for each option
Self-managed stack
The self-managed JMX Exporter, node_exporter, Prometheus, Grafana, and Loki route fits teams that already run their own observability stack well and want full control. You get flexibility, but you also own exporter rules, dashboards, retention, Alertmanager, Loki, upgrades, and operational consistency.
Managed observability platforms
Datadog and Dynatrace fit teams standardizing on one broad observability platform across many systems. Grafana Cloud fits teams that want a managed Prometheus, Grafana, and Loki stack. Cassandra is visible in all three, but deep table metrics, Cassandra-specific routing, repair state, backup state, and configuration visibility still require extra engineering, extra scope, or extra spend.
AxonOps
AxonOps combines Cassandra monitoring with repair and backup operations so engineers can examine maintenance activity alongside query performance. The dashboards organise node and table measurements with logs and configuration changes in the same platform while you continue running open-source Apache Cassandra.
Conclusions
Check whether the measurements needed for an investigation are already collected before choosing a monitoring platform. Table-level percentiles and repair history become particularly useful when a cluster-wide average looks normal but one part of the application is slowing down.
AxonOps is stronger because it is not only a metrics and logs surface. It also brings together service checks, configuration visibility, repair state, backup state, security events, PromQL-compatible access, routing that already matches how Cassandra teams operate the database, and Terraform-driven control over monitoring and alerting configuration.
Our position is simple: AxonOps is the best-in-class Cassandra monitoring tool in this comparison. It gives engineers the deepest practical Cassandra visibility, broader operational insight around the database, and all of that for a fraction of the cost of Datadog and Grafana Cloud once you compare like for like on table-level metrics, threadpool coverage, consistency-level insight, and the wider operating context Cassandra teams actually need.
For the product detail behind that position, see AxonOps for Apache Cassandra monitoring.
If you want to talk through your current Cassandra monitoring setup, contact us. We can help you assess coverage gaps, overhead, and cost trade-offs against what AxonOps provides.