
Your orders-service consumer group is reporting a lag of 5800 and you’re wondering whether adding another consumer would help. Before changing anything we can break that total down by partition to see where the backlog is building up.
For this example we created a local orders topic with three partitions and wrote 10000 records to each partition. We then set the group’s committed offsets to the values below so we could check how Kafka reports an uneven backlog.
| Partition | Commit | End | Lag |
|---|---|---|---|
| 0 | 9,800 | 10,000 | 200 |
| 1 | 4,500 | 10,000 | 5,500 |
| 2 | 9,900 | 10,000 | 100 |
| Total | 5,800 |
Almost all the lag belongs to partition 1 while the other two partitions are much closer to their end offsets. If each partition already has its own consumer then adding a fourth member won’t let us divide partition 1’s work between them. Within a regular consumer group each partition is assigned to one member at a time.
Let’s say partition 1 receives 900 records per second while its consumer finishes processing 500. Its backlog grows by 400 records every second even if the consumers handling the other partitions have plenty of spare capacity.
We can investigate this by looking at the keys reaching partition 1 alongside the time its consumer spends processing each record. A frequently used key could be directing most of the traffic there or the consumer might be spending most of its time waiting for a database write to finish.
The captured offsets and transaction checks come from a local Kafka 4.1.0 cluster using Java clients 4.1.0 with explanations drawn from the Apache 4.1 documentation. The 900-versus-500 rate example above and the five-minute catch-up calculation below are illustrative. We’re looking at regular consumer groups here because share groups distribute work differently.
What Consumer Lag Measures
Before we go further with the calculation it helps to know what Kafka has saved for the group. The committed offset normally identifies the next record to read when consumption resumes so a value of 9800 means the group can resume from that position. The end offset also identifies a position just beyond the end of the log.
For partition 0 we subtract the committed offset from the end offset to get 10,000 - 9,800 = 200. In a simple log with consecutive offsets that covers records 9800 through 9999. The KafkaConsumer API documentation explains how this saved position differs from the consumer’s current position as it reads.
Those 200 records could take milliseconds to process or leave the consumer waiting on hundreds of slow database operations. To find out how long customers are waiting we also need to measure when the application finishes processing their requests.
We also need to allow for gaps in the offsets because compaction can remove records without renumbering the ones that remain. Transaction control records and aborted transactions further affect what the application receives so subtracting offsets doesn’t always give an exact count of unfinished business operations.
Read the Group Offsets
To inspect your own group you can run this read-only command from the Kafka distribution after replacing the bootstrap address and group name. The client.properties file needs the TLS and authentication settings required by your cluster.
bin/kafka-consumer-groups.sh \
  --bootstrap-server broker.example.com:9092 \
  --command-config client.properties \
  --describe --group orders-service
We can read the output using the following field definitions from the 4.1.0 implementation and compare each partition with our example.
| CLI field | Meaning |
|---|---|
CURRENT-OFFSET | The group’s committed offset for that partition |
LOG-END-OFFSET | The latest offset returned by the Admin client’s partition-offset lookup |
LAG | Returned end offset minus committed offset when both are known |
CONSUMER-ID | The member currently assigned to that partition when available |
The end offset comes from OffsetSpec.latest() with default ListOffsetsOptions that use read-uncommitted isolation. These options belong to the Admin client running the command so the lookup doesn’t pick up the isolation setting of the consumer application.
A missing committed offset means we don’t have a saved starting position to use in this calculation so it can’t be treated as zero lag. The group can also keep moving while the command collects its results which means the rows may reflect slightly different moments.
Here is the captured output for our orders-service group after setting its offsets and closing the test consumer.
GROUP           TOPIC           PARTITION  CURRENT-OFFSET  LOG-END-OFFSET  LAG             CONSUMER-ID     HOST            CLIENT-ID
orders-service  orders          0          9800            10000           200             -               -               -
orders-service  orders          1          4500            10000           5500            -               -               -
orders-service  orders          2          9900            10000           100             -               -               -
The three lag values add up to 5800 even though the group has no active members at the time of the capture. The dashes in the member columns describe that absence without erasing the group’s saved offsets or its backlog.
Committed Offsets and Processing
Now suppose the consumer has read a record and passed it to a worker that writes to a database. We need to know when the consumer commits its offset before we can use that offset to judge how much work has finished.
| Position or measurement | What it establishes | What it does not establish |
|---|---|---|
| Consumer’s current position | How far consumption has advanced | Completion of downstream work |
| Group’s committed offset | Where a replacement consumer should resume | Completion unless the application commits only after successful processing |
| Application completion record | The operation your application considers finished | Kafka offset progress unless the two are recorded together |
| Event-to-completion duration | Elapsed time using the application’s timestamp definition | An exact substitute for offset lag |
If the consumer keeps polling while database requests wait in a thread pool it may move well ahead of the work the application still needs to finish. Committing those offsets early can make the group look almost caught up while requests remain queued. An application that commits infrequently after successful processing can produce the opposite result because the CLI still shows records that have already been processed.
Before adding capacity we should check the application’s commit code alongside Kafka’s consumer settings for automatic commits and the maximum interval between polls. Those settings help explain offset progress but they can’t confirm whether an external database write has succeeded.
You may also find that the client lag chart disagrees with the CLI because the Java consumer’s records-lag-max follows its current position. The FetchMetricsRegistry definition uses that position while the group command uses committed offsets so both can report different values for the same application.
To check the difference we assigned partition 1 to a test consumer and polled without committing afterwards. Its position advanced to 5000 while the committed offset stayed at 4500 so the remaining distance to the end was 5000 from its position and 5500 from its commit. Those 500 fetched records hadn’t been written to an external system so the test doesn’t claim they represented completed application work.
Transactional Topics
An application using isolation.level=read_committed can reach a point where an earlier open transaction prevents it from reading further. It must wait at the last stable offset even when the CLI’s read-uncommitted lookup reports a later end position.
In that situation we need to check the producer’s transaction completion alongside the consumer’s isolation level before allocating more CPU to a consumer that is waiting. Kafka’s transaction and delivery design also explains the transaction guarantees within Kafka which don’t automatically include an arbitrary write to an external system.
We tested this with one record in a new topic while leaving its producer transaction open. The read-uncommitted end offset reached 1 while the last stable offset remained at 0 and the read-committed consumer received no records during its two-second poll. After committing the transaction the consumer received one application record while the end offset reached 2 because the commit marker also occupied an offset.
That consumer was waiting for the transaction to complete even though a later offset was visible through the Admin API. Adding another consumer wouldn’t have made the uncommitted record available sooner.
Catch-up Time
Once we know what the lag represents we can estimate how long the consumer needs to catch up after a burst. The useful comparison is between arriving records and completed processing measured over the same interval for the same partitions.
| Illustrative interval | Incoming records/s | Completed records/s | Backlog change |
|---|---|---|---|
| Traffic burst | 1,600 | 1,200 | Grows by 400/s |
| After the burst | 800 | 1,200 | Falls by 400/s |
| Sustained overload | 1,400 | 1,200 | Grows by 200/s |
If the burst leaves 120000 records waiting we can use the spare processing rate in the second row to estimate how long clearing them will take.
Spare processing rate = 1,200 - 800 = 400 records/s
Estimated catch-up time = 120,000 / 400 = 300 seconds
The consumer would catch up in five minutes if those rates stayed steady and no rebalances or retries interrupted its progress. This example assumes one offset step per application record and commits that follow completed processing. If records arrive as fast as the consumer finishes them then the backlog won’t shrink and a higher arrival rate will keep making it grow.
For our uneven orders topic we need to calculate that spare capacity separately for each partition. The consumers assigned to partitions 0 and 2 could finish their work while partition 1 continues falling behind.
Local Workload Checks
To check the difference between a burst and continuing overload we ran two small workloads with deliberately slowed consumers. Both used explicit partition assignment and committed after the simulated processing finished so these checks don’t measure group rebalances or downstream database performance.
| Local workload | Records produced | Records processed | Final lag | Test conditions |
|---|---|---|---|---|
| Burst followed by no new input | 1,200 | 1,200 | 0 | A 1 ms delay per record with the backlog drained in 1,769 ms |
| Continued input with slower processing | 1,200 | 600 | 600 | A 10 ms delay per record with the consumer stopped after processing 600 records |
During the second workload we captured the end offset and committed offset together so the arriving and completed records could be compared over the same interval.
| Time since measurement started | End offset | Committed offset | Completed records | Lag |
|---|---|---|---|---|
| 2,974 ms | 600 | 250 | 250 | 350 |
| 5,556 ms | 1,100 | 500 | 500 | 600 |
Between those samples another 500 records arrived while only 250 finished processing. Over roughly 2.58 seconds that works out at about 194 arrivals per second against 97 completions per second with lag growing by 250. Unlike the first workload there was no spare processing capacity during that interval to drain the backlog.
These are functional checks on a shared development machine with artificial delays so the measured rates shouldn’t be used to size a production cluster. They show how a backlog responds to a known processing deficit without claiming a Kafka throughput limit.
Hot Partitions
To investigate partition 1 we need to identify its assigned consumer and compare its processing time with the records reaching it.
The consumer-group tools include a read-only member description that shows which partitions each member has been assigned so we can find the relevant process.
bin/kafka-consumer-groups.sh \
  --bootstrap-server broker.example.com:9092 \
  --command-config client.properties \
  --describe --group orders-service --members --verbose
Check the records reaching that process for frequently repeated keys that could concentrate traffic on partition 1. Comparing their arrival rate with processing duration helps us decide whether to investigate the partitioning strategy or the work the application performs for each record.
Before changing the partition count we also need to check the application’s ordering requirements and how it chooses keys. Additional partitions can change where future records go but Kafka doesn’t redistribute the records already written to existing partitions.
Common Causes
| Observation | What to inspect | Possible response after confirming the cause |
|---|---|---|
| One partition falls behind | Key distribution and its assigned consumer | Improve processing capacity or revisit partitioning with ordering requirements understood |
| Many partitions fall behind after a deployment | Processing duration and application errors | Correct the regression or restore the previous application behaviour |
| Fetches continue but completion slows | Database and API latency plus worker queues | Address downstream limits and use bounded concurrency |
| Lag repeatedly jumps around membership changes | Group state and rebalance logs | Investigate restarts and poll delays for the configured group protocol |
| Fetch latency rises across applications | Broker request timing and disk or network pressure | Investigate the shared broker or infrastructure problem |
| Committed offset stalls despite successful processing | Commit failures and commit policy | Correct the commit failure without committing unfinished work |
| Read-committed consumers wait behind transactions | Transaction status and producer failures | Resolve the transaction problem rather than resetting consumer offsets |
When an investigation points to rebalances we should check the application’s group.protocol and client version before changing heartbeat or session-timeout settings. The classic and newer consumer-group protocols don’t use all of the same configuration options.
An offset reset can skip or repeat work without making the consumer process any faster. Moving offsets forward abandons records from the group’s current position while moving them back makes records available for processing again. Any reset therefore needs a recovery plan agreed with the application owner and is outside the read-only checks used here.
Monitoring Lag in AxonOps
In AxonOps you can find the affected consumer group and inspect its lag alongside its membership and state. The screenshot below shows the existing product interface and isn’t a recording of our local orders-service example.
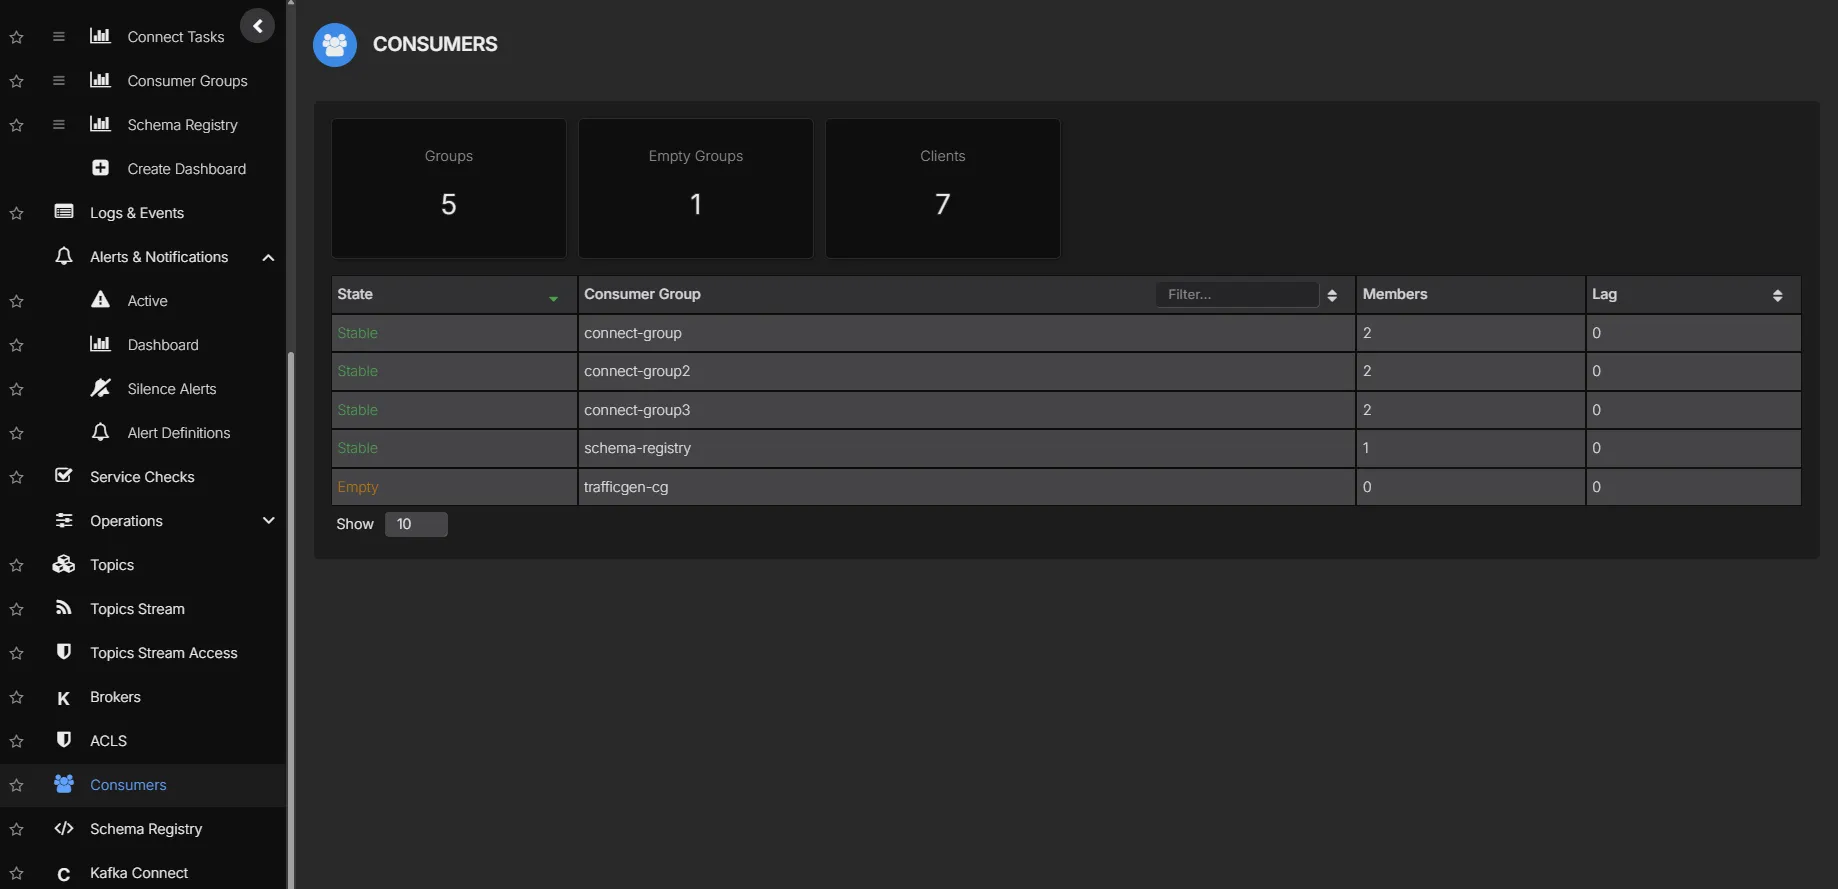
From that group we can compare the period when lag grew with the cluster metrics and logs to look for changes at the same time. The Kafka monitoring page shows the available dashboards and alerting controls while the application still needs its own measurement of processing duration.
The local checks used Kafka directly without an AxonOps installation so they don’t verify the product chart’s lag calculation or refresh interval. The captured CLI values shouldn’t be presented as measurements taken from that screenshot.
The accompanying Kafka metrics guide takes the same investigation into broker request timing and client measurements. Following the affected partition through those checks gives us a way to choose between an application fix and a broker investigation before paying for more capacity.