

Your producers are taking longer to receive acknowledgements and consumer lag is climbing even though broker CPU and incoming traffic look much the same as yesterday. Before adding capacity we can look at where requests spend their time and follow the delay through the affected brokers and applications.
A producer might be waiting for replicas to catch up while a consumer falls behind because each record triggers a slow database write. We need measurements from the brokers and the applications to work out which part of that process is slowing down.
We checked the metrics and commands against a local Kafka 4.1.0 cluster with four brokers and three KRaft controllers using definitions from the Apache 4.1 documentation and 4.1.0 source. The captured results below come from those checks while the worked 20 ms request is illustrative. Availability can vary with the deployed Kafka release and client library so the examples need to be matched to your own deployment.
Broker Metrics
Let’s start by comparing the affected brokers so a busy node doesn’t get hidden inside a cluster average. The Apache monitoring reference lists these JMX objects with request-specific measurements where applicable although an exporter may rename them or expose their attributes as separate series.
| JMX metric | Unit and attribute | How to use it |
|---|---|---|
kafka.server:type=BrokerTopicMetrics,name=BytesInPerSec | Bytes/s through a rate attribute such as OneMinuteRate | Compare incoming traffic across brokers and with previous periods |
kafka.server:type=BrokerTopicMetrics,name=BytesOutPerSec | Bytes/s through the same rate window | Look for extra consumer traffic and replays |
kafka.network:type=RequestMetrics,name=TotalTimeMs,request=Produce | Milliseconds through histogram attributes such as Mean and 99thPercentile | Track broker-side produce latency |
kafka.network:type=RequestMetrics,name=RequestQueueTimeMs,request=Produce | Milliseconds through histogram attributes | Identify time waiting for request handling |
kafka.server:type=ReplicaManager,name=UnderReplicatedPartitions | Partition count through Value | Find partitions with fewer in-sync replicas than their replication factor |
kafka.server:type=ReplicaManager,name=UnderMinIsrPartitionCount | Partition count through Value | Identify leader partitions below the configured minimum ISR |
The replication gauges in ReplicaManager help us check whether replicas have fallen behind while the partition still has a leader serving requests. Reduced redundancy can leave a partition available so we need to look at both its ISR and leader status before deciding what has failed.
To narrow the traffic comparison to a particular topic we can use the corresponding objects with a topic property. The broker total already includes that traffic so adding the total to its topic series would count the same bytes twice.
Request Latency
If the affected brokers show slower produce requests we can break the time down using the stages recorded in RequestChannel. The following metric names use kafka.network:type=RequestMetrics with request=Produce to separate local processing from time spent waiting afterwards.
Let’s follow a hypothetical produce request that uses acks=all and takes 20 ms on the broker without any quota throttling.
| Stage | Metric name | Illustrative duration | Next check |
|---|---|---|---|
| Waiting for a request handler | RequestQueueTimeMs | 2 ms | Request load and handler utilisation |
| Local processing | LocalTimeMs | 3 ms | Broker CPU and local I/O |
| Waiting after local processing | RemoteTimeMs | 12 ms | Follower replication and the ISR for the affected partitions |
| Waiting to send the response | ResponseQueueTimeMs | 1 ms | Network-thread availability |
| Sending the response | ResponseSendTimeMs | 2 ms | Network and client receive behaviour |
| Total broker request time | TotalTimeMs | 20 ms | Compare with the producer’s own request latency |
Of those 20 ms the request spends 12 ms waiting after local processing and only 2 ms waiting for a handler. That makes follower replication worth checking before adding handler threads although we still need the follower’s metrics to distinguish disk delays from CPU or network pressure.
We can add these stage durations because they belong to the same hypothetical request but adding the p99 values from separate histograms won’t give the total p99 latency. Each histogram can have different requests at its slow end so use TotalTimeMs for the total distribution and compare the individual stages alongside it.
When quotas apply we should also inspect ThrottleTimeMs to see whether Kafka is deliberately delaying requests. Fetch requests can spend time waiting for more data under their fetch settings so an increase in fetch duration needs to be checked against that configuration.
The local broker exposed Mean and Count alongside 99thPercentile for each of the request stages above. These were histogram samples collected through JMX so they let us check the available attributes without claiming to trace an individual request through every stage.
Replication Problems
For the replication check we’ll use a topic with replication factor three and min.insync.replicas=2 while the producer uses acks=all. These examples have Eligible Leader Replicas disabled because enabling ELR changes the behaviour we need to consider.
| Partition state | What it means for writes | Investigation |
|---|---|---|
| Three replicas in the ISR | Writes wait for the in-sync replicas | Compare replication delay when acknowledgements slow down |
| Two replicas in the ISR | Writes can still succeed but one replica has fallen out of sync | Find the missing replica and check its recovery progress |
| One replica in the ISR | Writes using acks=all cannot meet the configured minimum | Restore enough in-sync replicas and check producer errors |
| No available leader | Clients cannot use a healthy leader for that partition | Investigate broker availability and leader election |
With all three replicas in the ISR the producer still waits for the in-sync replicas even though the minimum ISR configuration is set to two. That setting determines the minimum required for these writes without reducing a healthy three-replica ISR to a two-replica acknowledgement rule. A deployment with ELR enabled needs its feature-specific semantics checked separately.
The read-only topic description below shows the leader and ISR so we can identify which replicas to investigate. Replace the bootstrap address and use a client configuration containing the TLS and authentication settings for your cluster.
bin/kafka-topics.sh \
  --bootstrap-server broker.example.com:9092 \
  --command-config client.properties \
  --describe --topic orders
Once we know which replica is missing from the ISR we can check its broker logs alongside its recovery progress. Lowering the minimum ISR changes the durability requirements under which writes may continue but leaves the replica problem unresolved.
For the local check we assigned the topic’s replicas to brokers 1,3,4 while controllers ran on nodes 1 through 3. Stopping broker 4 and then node 3 reduced the ISR without losing the controller majority on nodes 1 and 2.
| Captured ISR | Observed write result with acks=all |
|---|---|
1,3,4 | Accepted at offset 0 |
1,3 | Accepted at offset 1 |
1 | Broker returned NOT_ENOUGH_REPLICAS and the producer exhausted its eight-second delivery timeout |
The surviving controllers continued to make metadata progress during the final check so we could distinguish the minimum-ISR write failure from a controller quorum failure. These broker shutdowns belong in an isolated test environment and aren’t part of the read-only investigation commands in this guide.
KRaft Monitoring
If metadata operations are also getting stuck we need to look at the KRaft controllers that maintain cluster metadata. Their quorum is separate from topic replication so consumers can still be fetching records while metadata changes are failing to progress.
| Metric | Process and unit | Interpretation |
|---|---|---|
kafka.controller:type=KafkaController,name=ActiveControllerCount | Controller gauge with Value of zero or one | Expect one active controller across a healthy controller quorum |
kafka.server:type=raft-metrics attribute current-state | Raft member state string | Identify the leader and followers while investigating elections |
kafka.server:type=raft-metrics attribute high-watermark | Metadata log offset | Check progress over time when metadata changes are expected |
kafka.server:type=raft-metrics attribute commit-latency-avg | Milliseconds on the quorum leader | Investigate slower metadata log commits |
Keep these measurements labelled by controller node so you can compare the leader with its followers using the definitions in QuorumControllerMetrics and KafkaRaftMetrics. If samples stop arriving we first need to check collection because missing data doesn’t tell us that the controller has become inactive.
To inspect the quorum directly we can run the following read-only status check using the metadata quorum tool with the same client configuration.
bin/kafka-metadata-quorum.sh \
  --bootstrap-server broker.example.com:9092 \
  --command-config client.properties \
  describe --status
A metadata offset that stays unchanged while operations are waiting gives us a reason to investigate the quorum. During a quiet period with no metadata changes to commit we wouldn’t expect the offset to keep advancing.
Our three controllers reported ActiveControllerCount values of 0 / 1 / 0 and the following attributes came from the raft metrics on a follower.
current-state=follower
high-watermark=130.0
commit-latency-avg=NaN
The follower’s NaN value isn’t a measurement of zero commit latency so it shouldn’t be converted into a reassuring zero on a chart. For deployments with dedicated controller processes we also need collection from those JVMs because a broker-only installation can’t establish controller coverage.
Producer and Consumer Metrics
If broker timings don’t explain the application’s delay we need measurements from the process running the producer or consumer. A broker JVM doesn’t expose the Java client’s local metrics and other client libraries can have their own names and collection methods.
| Java client attribute | Metric group | Unit | Use |
|---|---|---|---|
record-queue-time-avg | kafka.producer:type=producer-metrics,client-id=... | Milliseconds | Time batches spend in the producer’s send buffer |
request-latency-avg | Same producer group | Milliseconds | Request latency seen by the producer |
record-retry-rate | Same producer group | Retried record sends/s | Repeated sends that need an error and timeout investigation |
records-lag-max | kafka.consumer:type=consumer-fetch-manager-metrics,client-id=... | Offset-distance lag | Largest partition lag in the window based on the consumer’s current position |
records-consumed-rate | Same consumer group | Records/s | Fetch consumption rate rather than confirmed downstream completion |
fetch-latency-avg | Same consumer group | Milliseconds | Duration of consumer fetch requests |
The producer’s measurements are defined in SenderMetricsRegistry while FetchMetricsRegistry defines the consumer measurements used here. A consumer that has fetched records but hasn’t finished processing them can have a current position well ahead of its committed offset.
For a producer we can compare queue time with the batching delay configured through linger.ms before deciding whether it is waiting unexpectedly. Some time in the send buffer can be intentional because the producer is collecting records into a batch.
The consumer lag guide follows an orders topic through the difference between committed offsets and processing rates. If those records trigger work in another system we also need to measure when that work finishes to understand the delay experienced by users.
Kafka Connect Metrics
For a Kafka Connect sink we can make a similar comparison between records read from Kafka and records delivered to the destination. A task can keep reading successfully while a slow destination leaves more of its work unfinished.
| Sink-task attribute | Unit | Interpretation |
|---|---|---|
sink-record-read-rate | Records/s | Reads before transformations |
sink-record-send-rate | Records/s | Records passed to the sink task after transformations |
sink-record-active-count | Records | Read records not yet completely committed or acknowledged by the task |
The sink-task attributes use kafka.connect:type=sink-task-metrics,connector=...,task=... and are recorded by WorkerSinkTask. Read and send rates can differ when a transformation filters records so we should compare growing active-record counts with destination latency and task logs before concluding that delivery has slowed.
We checked these attributes with a local Connect 4.1.0 FileStreamSinkConnector that wrote 200 records to a temporary file without any filtering transformations. The connector and task both reported RUNNING while the immediate JMX sample still showed sink-record-active-count=200.0.
The records had reached the file while the task still counted them as active at that sampling point. We didn’t capture the later transition to zero so a single active-count sample wouldn’t justify diagnosing a stuck sink without checking its progress over time.
Alerts and Investigation
Once we understand the source of the delay we can set alerts around how long the application can reasonably wait. A backlog that drains after a scheduled batch job needs a different response from a payment consumer that has stopped processing.
| Condition | Useful alert context |
|---|---|
| Under-replicated partitions persist | Affected brokers and topics plus maintenance activity |
| Produce latency rises | Request stages and producer errors over the same window |
| Lag grows continuously | Incoming rate and completed processing rate plus the affected partitions |
| Controller state changes repeatedly | Quorum membership and metadata operation failures |
| Disk free space is declining | Growth rate and room for recovery or reassignment |
| Telemetry stops arriving | Collection failure distinguished from a genuine zero value |
Keep enough history at the original sampling resolution to compare a short slowdown with the period before it began. Use the same time windows when comparing rates and keep broker percentiles separate because averaging them doesn’t produce a cluster-wide percentile.
Kafka Monitoring in AxonOps
In AxonOps we can move between broker and topic views and inspect consumer groups or Connect as the investigation develops. Those views can be checked alongside logs and events to follow the period when the delay began. The screenshot below shows an existing consumer-group view rather than a capture of the local test workload.
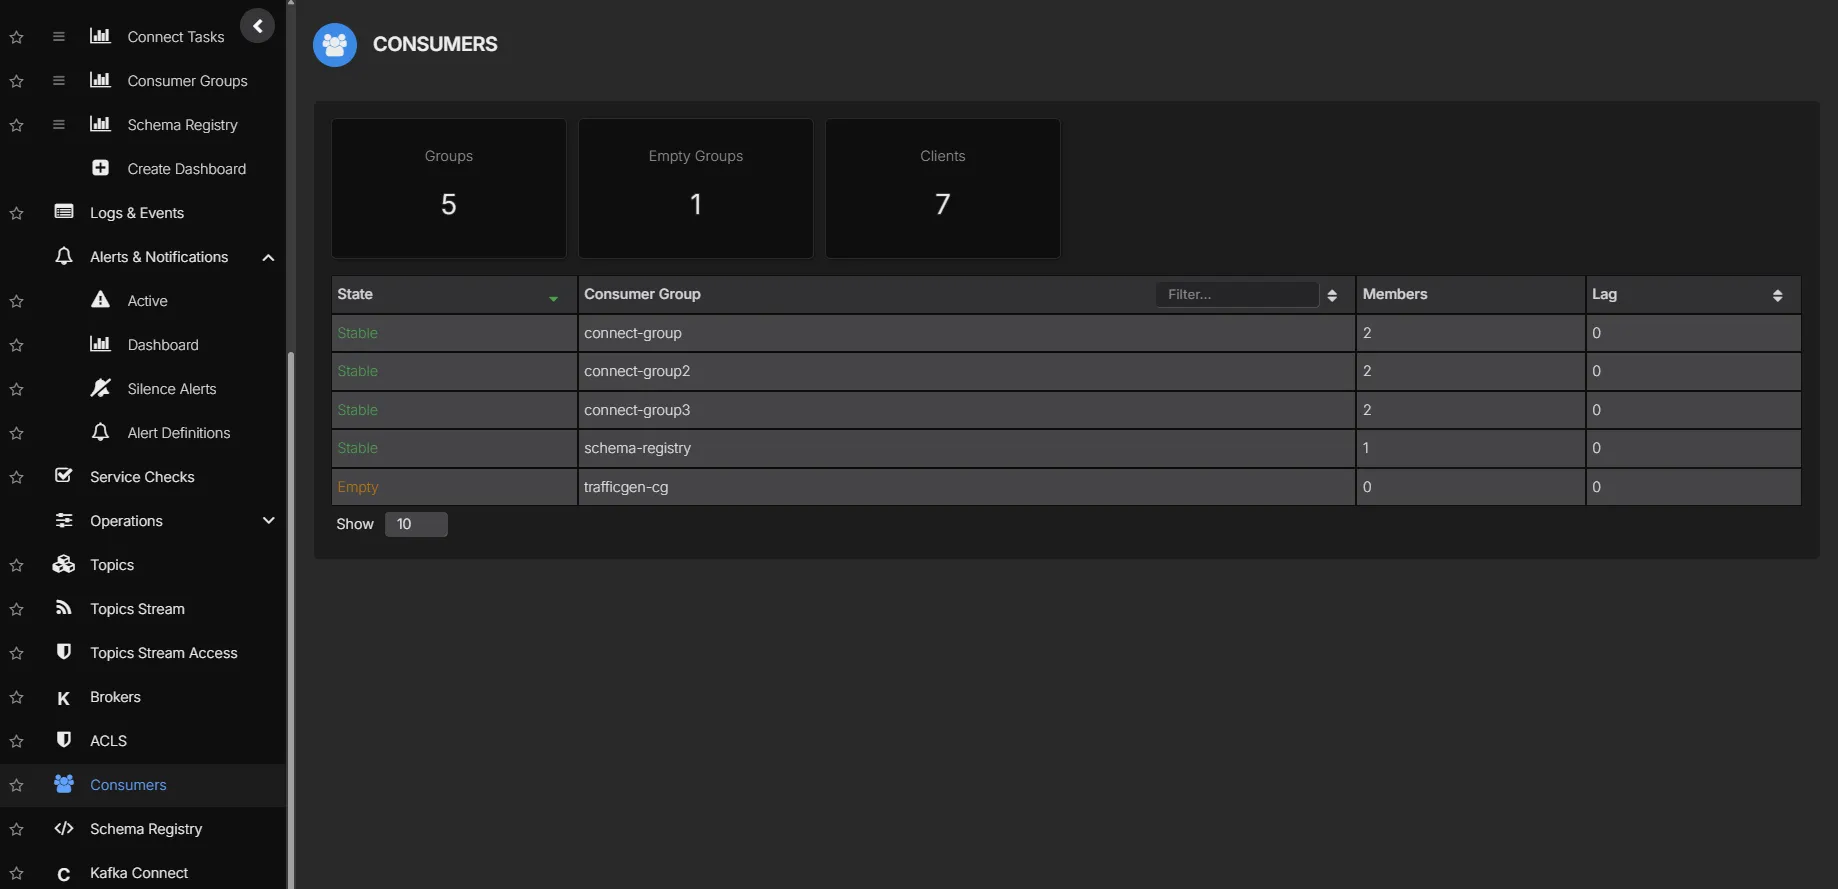
The Kafka monitoring page shows the dashboards and alerting controls available for those checks. Client-side measurements still need collection from the relevant application integration so a broker agent alone shouldn’t be assumed to provide every metric in this guide.
The local exercise verified Kafka behaviour through its APIs and JMX without an AxonOps installation. It therefore doesn’t establish which of these attributes an AxonOps deployment collects or how its dashboards aggregate them.
Our Kafka monitoring and operations overview covers how these views fit into day-to-day Kafka operations. For the delayed acknowledgements we started with we can now compare the broker’s request stages with replication progress and the producer’s own timing before deciding what needs to change.