
A Kafka Connect pipeline can stop delivering records while its connector still reports RUNNING because the connector and its tasks have separate states. In AxonOps you can see which task failed and check its processing history before changing its configuration or restarting it.
Let’s follow an orders pipeline through that investigation using the AxonOps interface. We’ll find the affected task and use its metrics to decide what to change before checking that records are reaching their destination again. We’ll also look at failure alerts and automatic restarts so the next incident doesn’t depend on someone having the dashboard open.
The connector screenshots show the kafka-webinar cluster while the orders-sink example below describes a separate failure scenario. This assumes your Connect cluster is already visible in AxonOps with worker metrics being collected. The Connect setup guide covers connecting the agent to your Connect clusters.
Find the Failed Task
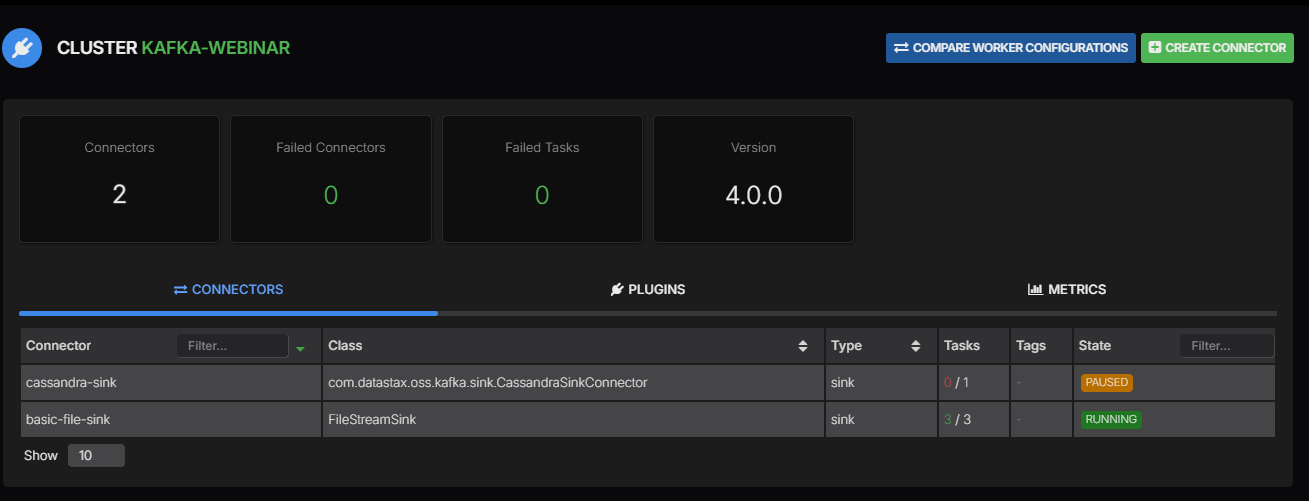
Open Kafka Connect in AxonOps to see your Connect clusters and their failure counts together. The overview separates Failed Connectors from Failed Tasks so you can find a task failure even when the connector itself is still running.
The cluster view above shows basic-file-sink with three running tasks and cassandra-sink paused with none running.
- Select the Connect cluster with failed tasks and open its Connectors tab.
- Check the running-task ratio alongside each connector’s state. Filtering only for connectors in
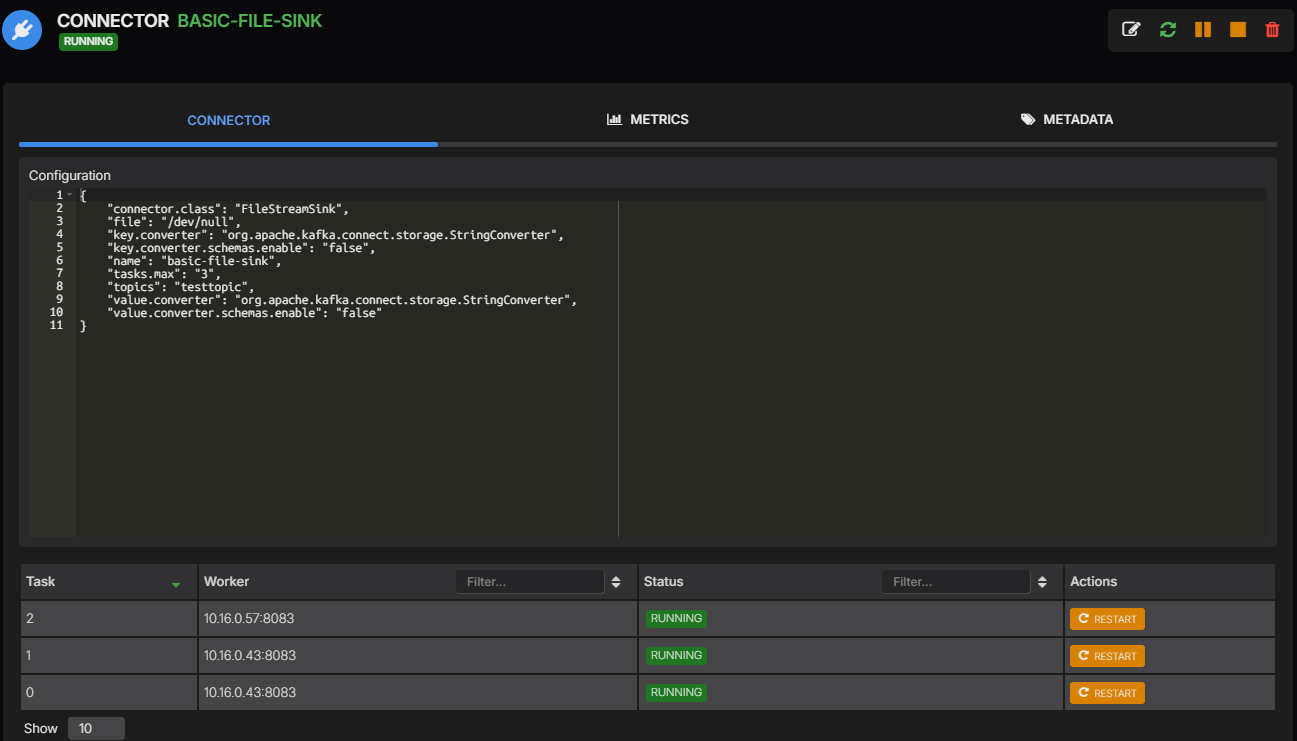
FAILEDwould miss a running connector with a failed task. - Open the affected connector and find the task in its Tasks table. Note its task ID and assigned worker so you can select the same task in the metrics dashboard.
For our orders-sink example the connector could show RUNNING with task 0 in FAILED. You now know which part of the pipeline needs attention without restarting every connector on the worker.
Set Up Failure Alerts
Enable Kafka Connect Checks under the Kafka cluster’s Settings in the Kafka section. Save the change to start checking connector and task states through AxonOps. These checks are off by default and require a reachable Connect cluster.
AxonOps checks tasks separately when their connector is running. A failed task therefore raises an alert even when the parent connector hasn’t failed. The check also reports other non-running states so allow for deliberately paused or stopped connectors when choosing which ones to monitor.
Use the connector’s Metadata tab to choose its alerting policy and notification routing. The per-connector alert settings let you monitor selected pipelines without applying the same policy to every connector.
| Setting | How to use it |
|---|---|
| Use the cluster setting | Include the connector when the cluster-wide Connect check is enabled |
| Always alert | Monitor an important connector even when the cluster-wide check is off |
| Never alert | Exclude the connector from the check and its automatic restarts |
| Alert Routing | Send this connector’s notifications to its responsible team through your configured integrations |
The checks normally run about every 30 seconds so status alerts and their resolution follow a check cycle. You’ll find unresolved alerts under Alerts & Notifications in Active. Keep worker availability monitoring alongside them because a Connect cluster that cannot be queried doesn’t return fresh task states.
Investigate the Connect Metrics
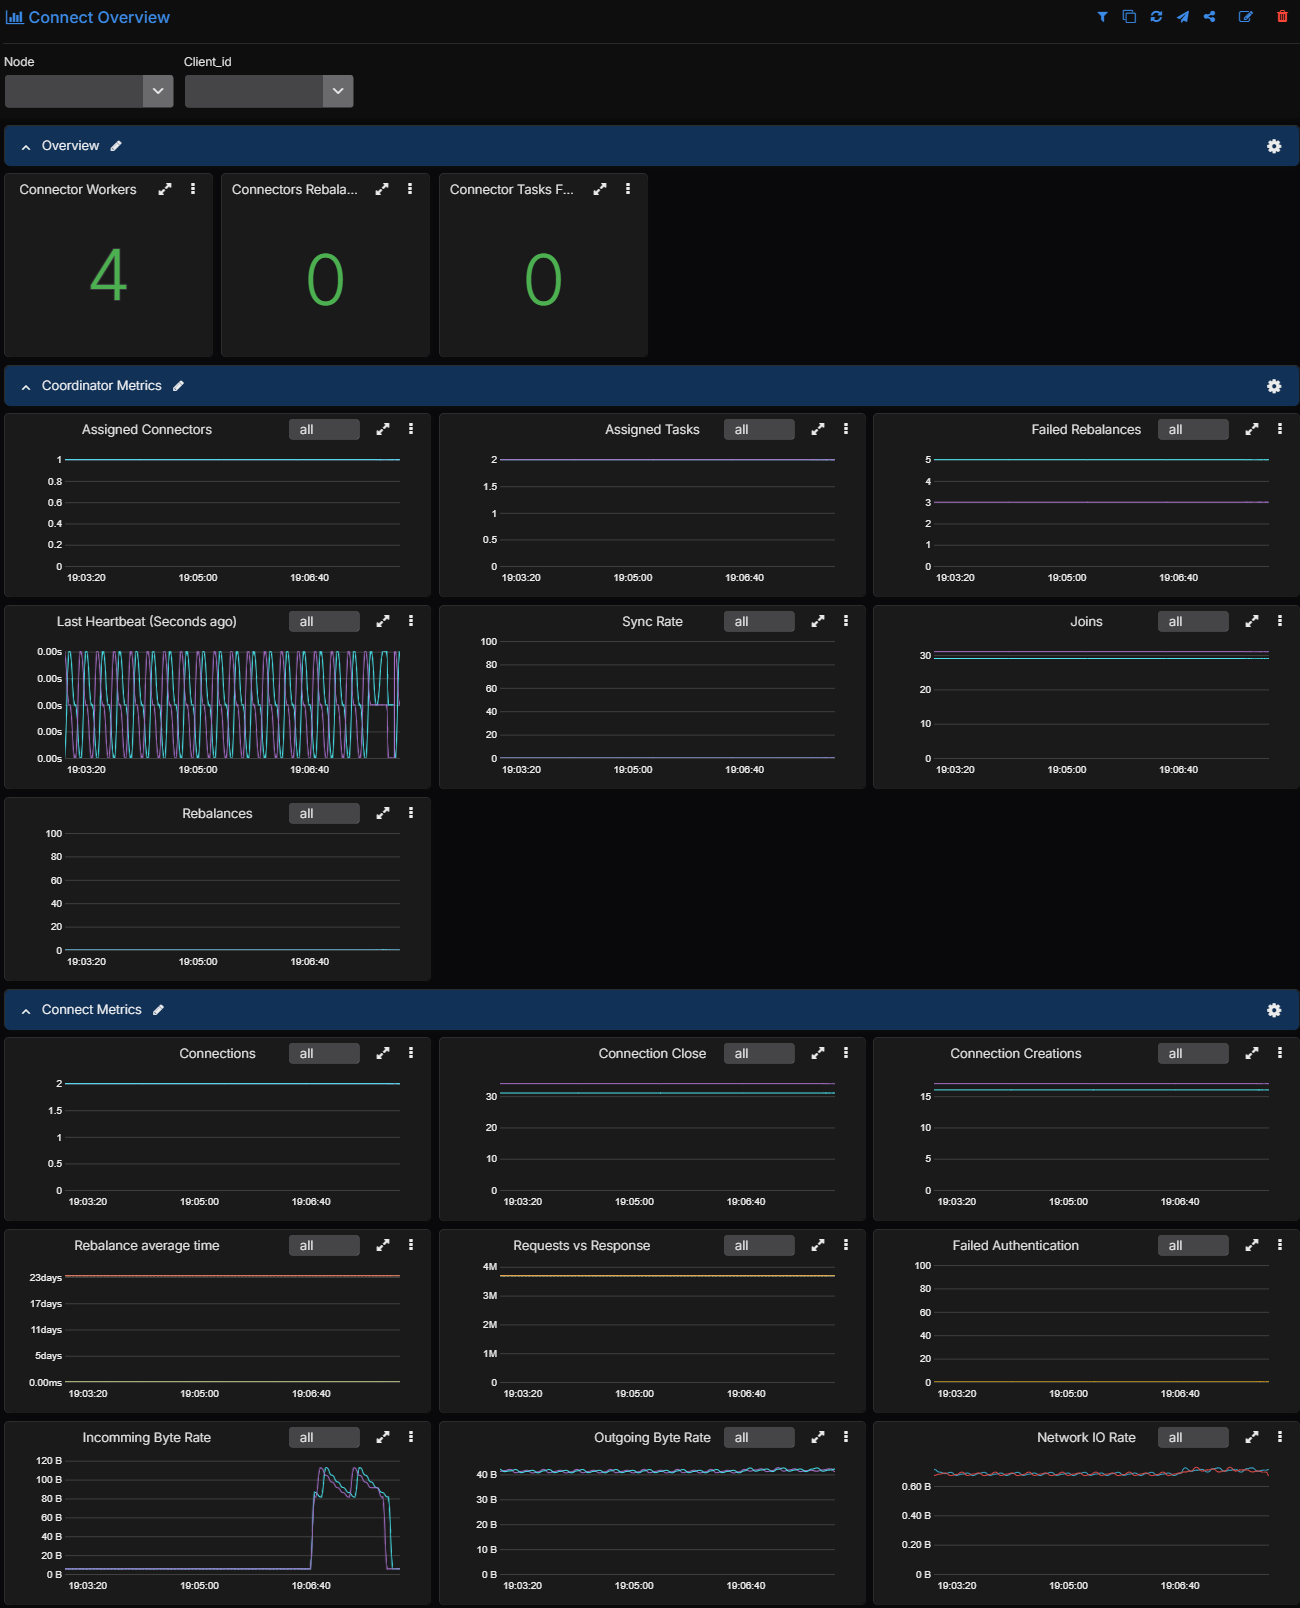
The Connect Overview dashboard brings worker counts and coordinator activity together with Connect network metrics. Check the period around the failure for changes in worker assignments or rebalances before looking at the affected task.
Select the affected connector and task in the AxonOps Connect Tasks dashboard and use a time range that includes the start of the failure. You can compare processing activity with errors and commit behaviour for that task rather than combining readings from unrelated pipelines.
| Dashboard measurement | What to investigate |
|---|---|
| Sink Task Record Read and Sink Task Record Send | Whether the task is reading from Kafka and passing records to the sink. A widening difference needs checking against filtering and rejected records as well as processing delays |
| Sink Task Record Active Count | Whether records are accumulating inside the task while delivery slows |
| Record Errors and Record Failures | Whether processing problems began at the same time as the interruption |
| Record Skipped | Whether the task is continuing by skipping records that still need investigation |
| Deadletter Produce Failures | Whether attempts to retain rejected records in the DLQ are failing too |
| Connector Task Commit Success % and Commit Avg vs Max time | Whether saving processing progress is failing or taking longer than usual |
The Connect Tasks dashboard reference lists these measurements and their filters. For failures affecting several connectors on the same worker you can use the Connect Workers dashboard to compare failed-task counts with startup failures and rebalances.
Suppose the errors begin just after a producer deployment while the broker remains healthy. Check the connector’s expected data format before changing worker resources. If worker logs are collected in AxonOps you can open Logs & Events for the same period and look for the corresponding exception.
In our example a producer has sent this incomplete JSON record to orders.
{"order_id":"order-1002","amount":19A task using JsonConverter cannot parse it because the closing brace is missing. With errors.tolerance=none that conversion error stops the task before the record reaches the sink. Restarting it without addressing the record or the error-handling policy brings it back to the same failure.
Correct the Connector Configuration
Return to the connector detail page and review its Configuration alongside the task information. The Edit control opens the JSON editor so you can update the existing configuration in AxonOps.
For the malformed order we need to decide whether later orders may continue while someone investigates the rejected one. That depends on the application because processing later records first can change the order in which updates reach the destination.
If the application permits this we can configure a dead-letter queue. Create orders-dlq through AxonOps’ topic creation page with the replication settings required for your cluster and give the connector permission to write to it. Then merge these properties into the connector’s existing configuration in the editor.
{
  "errors.tolerance": "all",
  "errors.deadletterqueue.topic.name": "orders-dlq",
  "errors.deadletterqueue.context.headers.enable": "true"
}
These properties are additions to the configuration so retain the connector class and its existing connection and conversion settings. Review the complete configuration before saving and check task status afterwards because applying an update can restart tasks.
For eligible conversion errors this lets Connect retain the rejected bytes in orders-dlq while processing later valid records. Enabling error tolerance without a DLQ can skip eligible errors without retaining a DLQ copy. It also doesn’t make every destination failure recoverable through a DLQ because the connector’s own error handling still applies. Our Connect error-handling guide explains that scope.
If the failure followed a configuration change you can also review AxonOps’ configuration drift history when connector tracking was enabled beforehand. Select the relevant entry in Changes to compare the previous and current settings. Enable both organisation storage and Connectors tracking in Config Drift Detection to retain these comparisons for future investigations.
Restart the Failed Task
Once the cause has been addressed use Restart on the affected row in the connector’s Tasks table if the task is still failed. This targets that task while the connector toolbar’s restart action restarts the connector and all its tasks.
Return to task status and the dashboard after the request. A successful restart request means Connect accepted the action and you’ll still need to confirm that the task stays running and resumes processing. If the destination remains unavailable or the converter receives the same invalid record the task can fail again.
For failures that can recover without a configuration change you can enable Auto Restart Failed Connectors in the Kafka Connect Checks settings. Set both restart fields explicitly before saving so the behaviour matches your recovery policy.

Max Restart Count limits accepted restart attempts for each connector or task. Restart Interval sets the minimum time between attempts while the next check cycle decides whether another restart is needed. Requests that fail aren’t counted as accepted attempts.
Only the FAILED state is eligible for automatic restart so AxonOps doesn’t restart a deliberately paused or stopped connector. When the accepted attempts reach the limit it raises a critical alert for manual intervention. Review the currently failed connectors before enabling this across a cluster because several tasks can be restarted in the same cycle.
Restart attempts are recorded in Logs & Events with the KafkaConnectCheck event type. The automatic restart guide covers per-connector exclusions and how restart counts are retained. For our malformed order we would address the conversion failure before enabling retries because repeated restarts cannot repair its JSON.
Inspect Rejected Records
After the task resumes we still need to account for order-1002. A running task and falling consumer lag can coexist with records in the DLQ that have never reached the destination.
Use the AxonOps Message Stream Viewer to inspect orders-dlq from the browser. Message streaming needs a configured stream server and an explicit access grant for the user or group. Restrict that grant to the topics needed for the investigation because rejected records can contain sensitive data.
- Open the topic stream viewer and select
orders-dlqin the Topic field. - Choose a starting position. Use Specify Partition Offsets for a known DLQ position or Specify Partition Timestamps to inspect records around the failure.
- Set Limit returned rows before connecting and starting the stream.
- Show Headers alongside the message so you can identify the original topic and record location.
With context headers enabled the rejected order carries its original location and the stage that failed.
| DLQ header | Value in our example |
|---|---|
__connect.errors.topic | orders |
__connect.errors.partition | 0 |
__connect.errors.offset | 1 |
__connect.errors.stage | VALUE_CONVERTER |
The DLQ record has its own offset which differs from the original record’s position. Use the headers when tracing it back to orders and keep that location with the recovery record. The message viewer guide covers access grants and stream controls.
Inspection gives the application team the original bytes and error context needed to correct the order. Resubmission should follow the application’s approved replay process with checks for ordering and duplicate effects at the destination. Restarting the connector doesn’t replay its DLQ or correct the rejected data.
Check Delivery After Recovery
Back in AxonOps select the same connector and task to check processing after the restart. Compare the read and send measurements with commit success and look for further increases in record errors or DLQ write failures. Task counters can reset when tasks are recreated so compare activity over the recovery period rather than treating a lower cumulative total as missing data.
Confirm the records at the destination as well because a task’s RUNNING status cannot establish that an order was written correctly. For our example recovery includes both the later valid orders and the corrected order-1002. The application team should be able to identify the resubmission and account for its original DLQ entry.
You can keep the connector’s status and recovery actions in AxonOps while using its dashboards to check whether the change restored processing. The Kafka monitoring metrics guide covers the broker measurements to compare when several pipelines are affected. To explore the connector views yourself open the AxonOps demo sandbox or see the Kafka Connect management page.
For a worked destination example our Kafka-to-Cassandra guide follows order records into a Cassandra table and tests updates and deletes alongside recovery and replay.